When talking about conversion rate optimisation (CRO) there is one subject that can be a little confusing or difficult to understand; statistical significance. What does that mean? Do I need to study statistics now? Don’t worry. We’ll explain what it means in a simple way. And no, you won’t need to study statistics.
In this third of our five blog series, we are going to explore the concepts of statistical significance and confidence level. We’ll explain why statistical significance is important in CRO and compare two statistical methods, the Frequentist and the Bayesian.
First, a definition:
Statistical significance is the likelihood of a result generated by testing or experimentation to be caused by something other than chance. After formulating a hypothesis in CRO, the winner can be proved by using statistical significance.
Frequentist vs. Bayesian
There are two different approaches to prove statistical significance – the Frequentist and the Bayesian model. There is a constant debate in the CRO world as to which one of these approaches is best. The Bayesian is more argumentative and based on random variables. The Frequentist is more conservative and based on fixed variables. It is important to note that different tools use different methods. However, despite the differences, both methods are valid.
The Frequentist approach
In the Frequentist approach you assume there is no difference between A (control) and B (variant), this is called a null hypothesis. When running an experiment you will be analysing the results of a sample of your website audience. Your audience, being the traffic to a specific page and the sample, being the visitors who were part of the experiment.
The results of your experiment depend only on the data captured during the period of the experiment itself. A challenge of Frequentist statistics is that you have only two possible outcomes: your experiment is the winner or not. In other words, you prove the null hypothesis to be right or fail to prove it, with no space for interpretations.
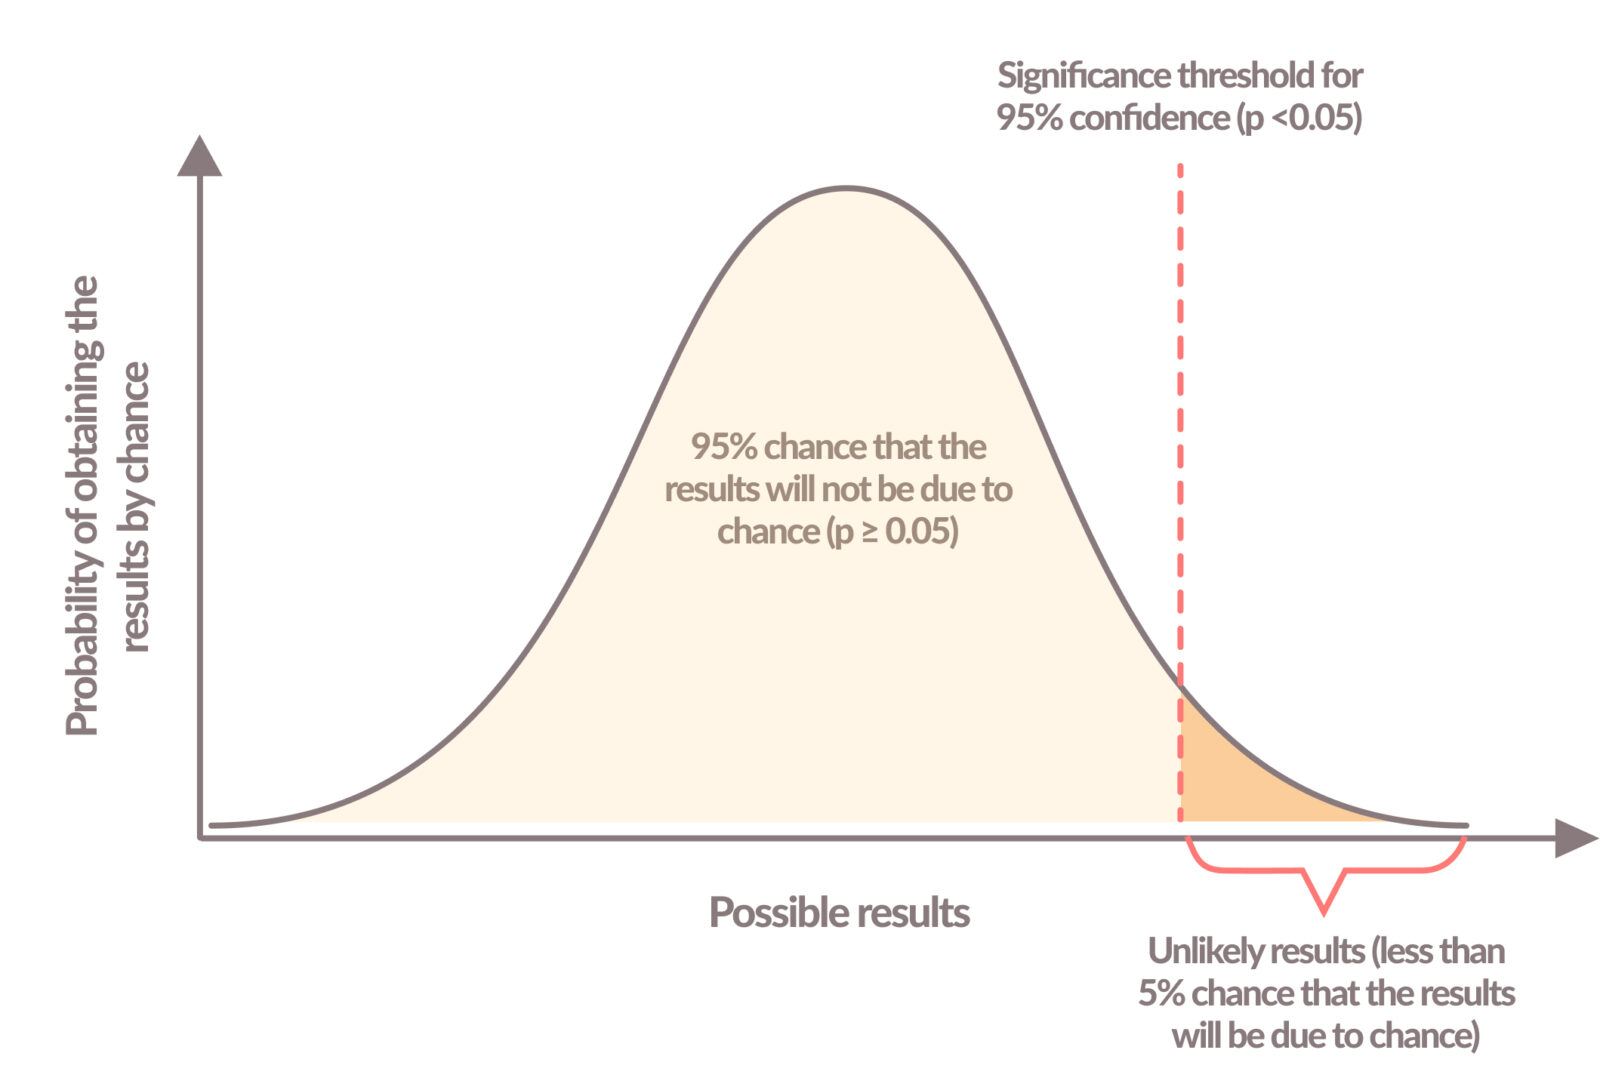
The level of statistical significance, often referred to as p-value, is a value between 0 and 1. By convention, if the results of the experiment show a p-value of > 0.05 it means that the null hypothesis cannot be rejected (or the null hypothesis is right) – in other words, the difference between A (control) and B (variant) could be due to chance and you do not have strong enough evidence to say that the new version (variant) is definitely better than the original (control). A p-value of < 0.05 means the null hypothesis can be rejected – in other words, the difference between A (control) and B (variant) could not be due to chance and you have strong enough evidence to say that the new version (variant) is definitely better than the original (control).
But what exactly does that mean? Translating that into percentages, we can say that in order to declare a winner the test results need to reach a confidence level of at least 95%.

The confidence level tells you how sure you can be. A 0% confidence level means you have no faith at all that if you repeat the test you would get the same results. A >99% (100% confidence level doesn’t exist in statistics) confidence level means there is no doubt at all that if you repeated the test you would get the same results.

If you are not able to identify a significant winner, you should not discard your test right away. You probably just need a few more conversions or a higher sample size. AB Tasty has an easy calculator you can use to help determine your ideal sample size to achieve statistically significant results. Also, as discussed in this blog it is recommended to run the test for at least two weeks.
The Bayesian approach
This statistical method has a more intuitive meaning. It is based on the premise of the “chance (of the variant) to beat control”. The Bayesian inference method gives you the probability of B being better (or worse) than A, and by how much. In this approach, the results observed in an experiment are taken into account for possible future outcomes.
Although the calculation can be extremely complex, there is no need to go too deeply into the maths. The Bayesian approach can be explained using the simple language of probabilities. For instance, “The variant is better than control with a 70% probability” or “The variant has a 70% chance of beating the control”.
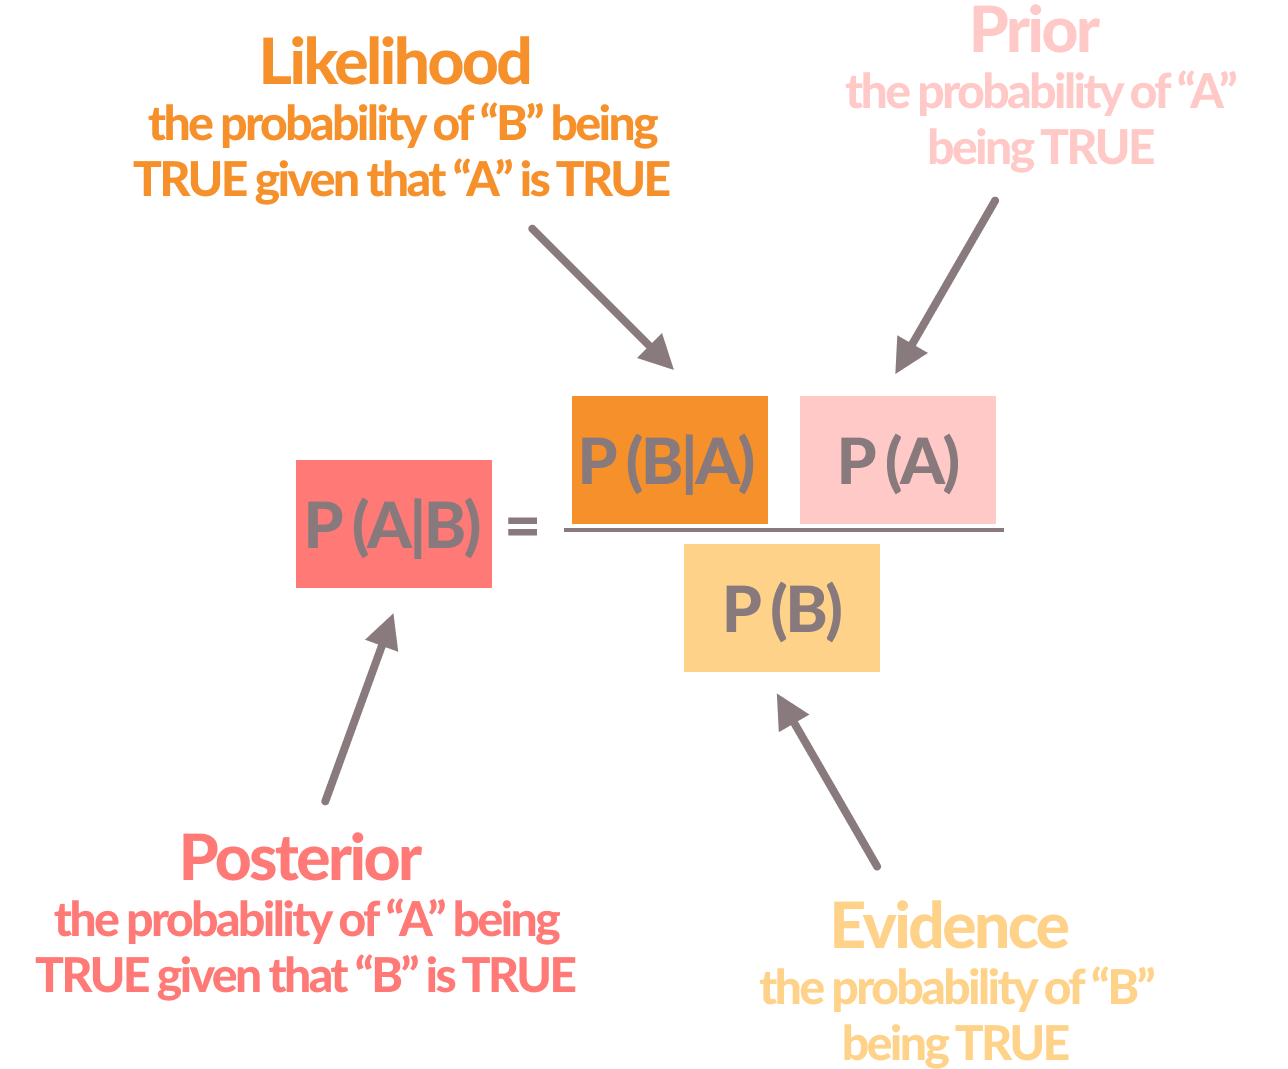
Here’s how the Bayes’ theorem formula looks like, just to give you an idea:

In a simplified way the Bayesian approach consists of:
- Posterior: result produced by the analysis (prior and evidence)
- Likelihood: the observed data
- Prior: data from previous experiments
- Evidence: results of the current experiment
The statistical interpretation of the Bayesian approach is not a 0 to 1 outcome like the Frequentist, but rather a 0 to 100% probability of the variant performing better than the control. To prove that the hypothesis is true, anything equal to or above 80% in case of a positive uplift, or anything equal to or below 20% for a negative uplift has a strong probability of beating the control. However, it would be better to have a larger sample size and the higher your probability the better. Here is a simple Bayesian calculator you could use.
Another advantage of this approach is that it works better for smaller sample sizes. This is valuable because it allows you to make faster decisions. As a downside, the result of the test does not have the same degree of statistical significance as the Frequentist approach. A statistician could say that the result of the CRO test using the Bayesian statistics is a good guess. On the other hand, in a business scenario, an educated guess can be considered good enough.
In conclusion, you do not need to pick a side or choose your favourite approach. The important thing is to understand the results of your experimentations using your CRO platform of choice.
In our next post, we‘ll talk about 5 common mistakes to avoid in CRO.


